ImportGenius delivers instant analytics for smarter, faster global trade decisions
Create dynamic dashboards, compare markets, and produce executive-ready reports—no spreadsheets or data teams required.
Data alone won’t keep you competitive—analysis will
Most teams struggle to make sense of raw shipment data. Exporting spreadsheets, building manual charts, and compiling reports slows down analysis–and by the time the insights arrive, market conditions have already shifted.
Advanced analytics & custom reports turn complex trade flows into clear, instantly digestible intelligence. With automated charts, network maps, and configurable dashboards, you can spot competitive threats, identify new suppliers, and track market trends in real time.

What you can do with advanced analytics & custom reports
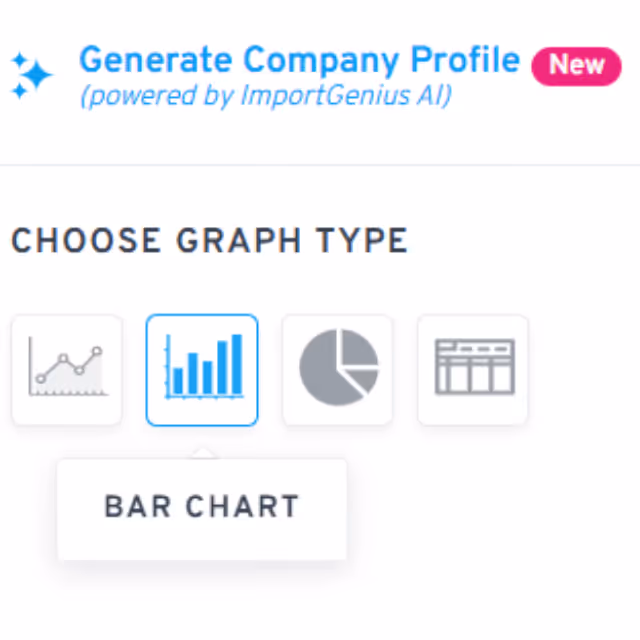
Click the ANALYTICS tab to visualize any search in seconds
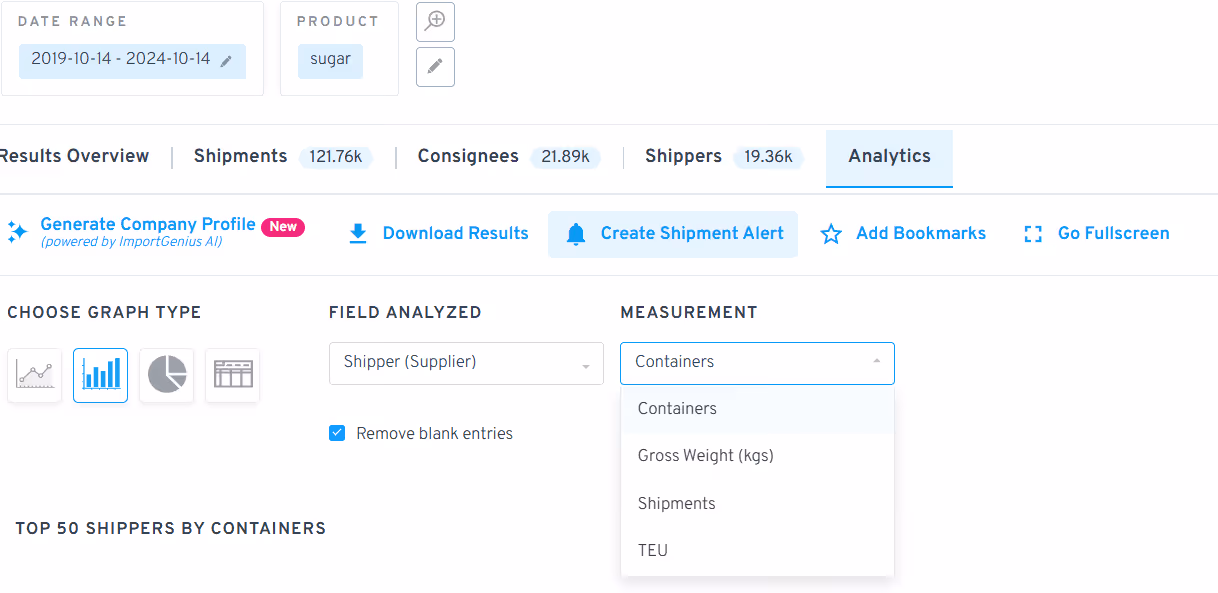
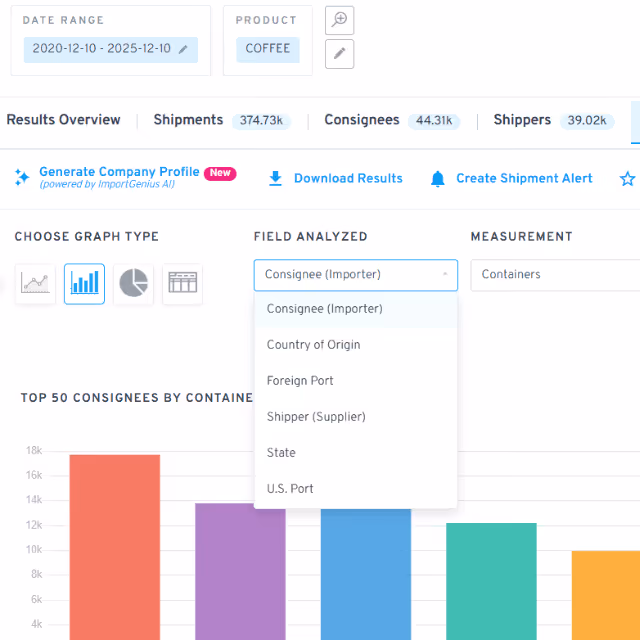
View activity by supplier, consignee, origin, port, state, and more
Switch between shipments, containers, gross weight, or TEU
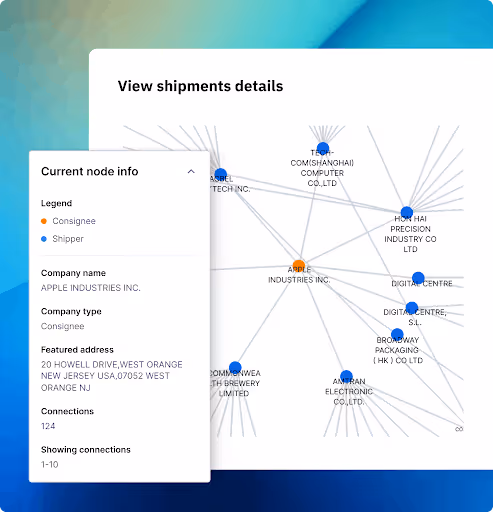
See automated diagrams showing how companies connect across supply chains
Build tailored views using advanced filters, fields, and measurement options
Download charts and insights to share with internal teams or partners
How advanced analytics transform your trade intelligence
ImportGenius turns any shipment search into a visual report—helping you interpret complex trade flows without spreadsheets or manual analysis.
Open Analytics
After running a search, click the Analytics tab to generate instant visual insights.
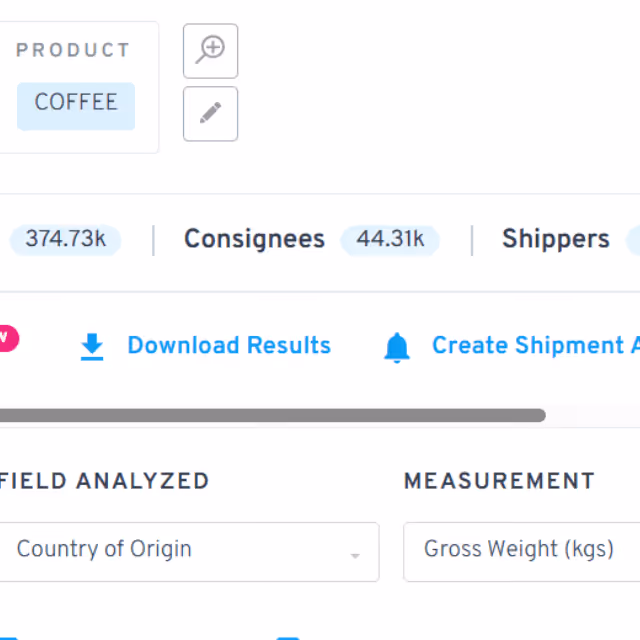
Choose what to analyze
Select dimensions like consignee, supplier, country of origin, port, or state.
Pick your measurement
View shipments, containers, gross weight, or TEU to understand activity at scale.
Customize & export
Apply filters, tailor dashboards, map relationships, and download clean reports.
Analytics available for all supported markets based on your subscribed country data. Export formats include charts, tables, and report summaries.
Who benefits most from this feature
Your competitors are analyzing the market—are you?
Trade patterns change quickly. Without timely analytics, shifts in supply, demand, or competitor behavior go unnoticed until it’s too late. With ImportGenius, you can transform raw shipment data into actionable insights instantly—giving you a strategic advantage in fast-moving markets.
Turn complex trade flows into actionable insights
Visualize global activity, build custom dashboards, and stay ahead with real-time analytics.

Frequently asked questions
No. Analytics are generated instantly inside ImportGenius—no spreadsheets required.
You can view shipments, containers, gross weight, and TEU depending on your subscribed country data.
Yes. Apply filters, choose dimensions, and tailor dashboards to specific teams or workflows.
Yes. Visualizations and reports can be downloaded for presentations, internal briefs, or sharing with stakeholders.
Analytics works for all markets included in your subscription, depending on the available data fields.