Track competitor shipment volumes and growth patterns confidently
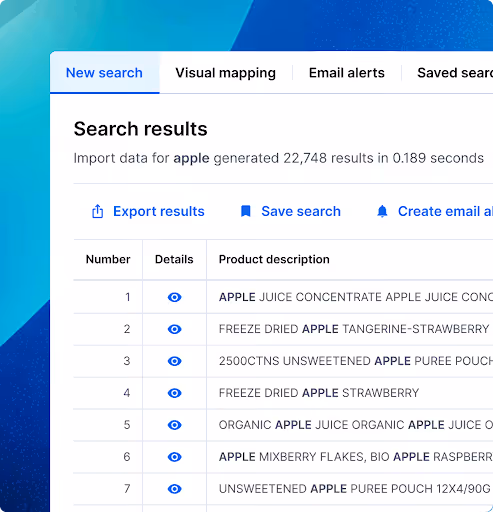
See shipment counts, TEUs, container volumes, weight, and product flows to understand how your competitors are expanding, contracting, and shifting strategy.
You can’t assess competitor strength without visibility into their shipment activity
Companies often monitor competitors based on guesswork or public announcements—long after market shifts have already happened. Without real shipment data, it’s impossible to understand their true growth trajectory, capacity changes, or entry into new markets. This leads to delayed decisions and missed competitive signals.


The importance of tracking shipment volumes and trends
Measure real competitor growth, not assumptions
Identify when rivals increase or decrease shipments
Detect seasonal patterns and long-term volume trends
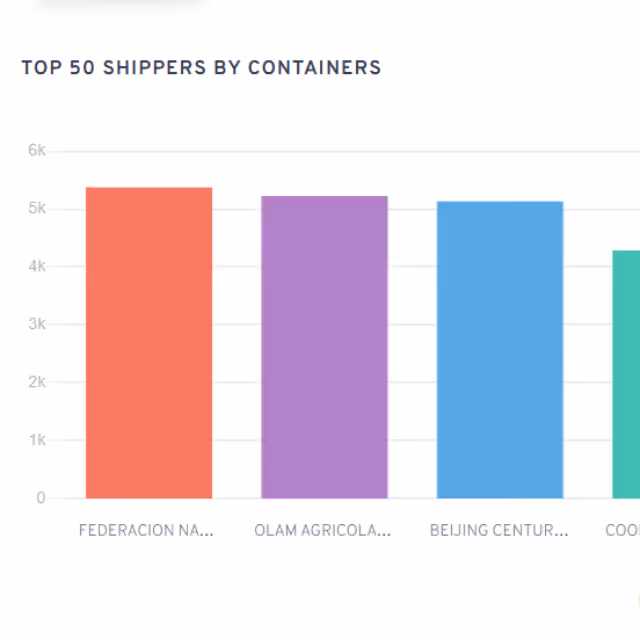
Spot new expansion areas based on rising product volumes
Validate your own market share assumptions
Forecast industry demand using historical shipment behavior
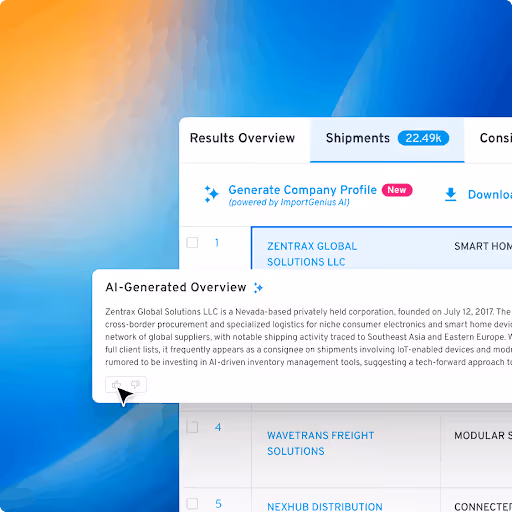
AI-powered Genius Company Profiler
Instantly understand a competitor’s shipment behavior, supplier network, and volume trends with AI-generated company summaries.
Global trade data coverage
Access shipment activity across multiple countries to see competitor volumes beyond the U.S.
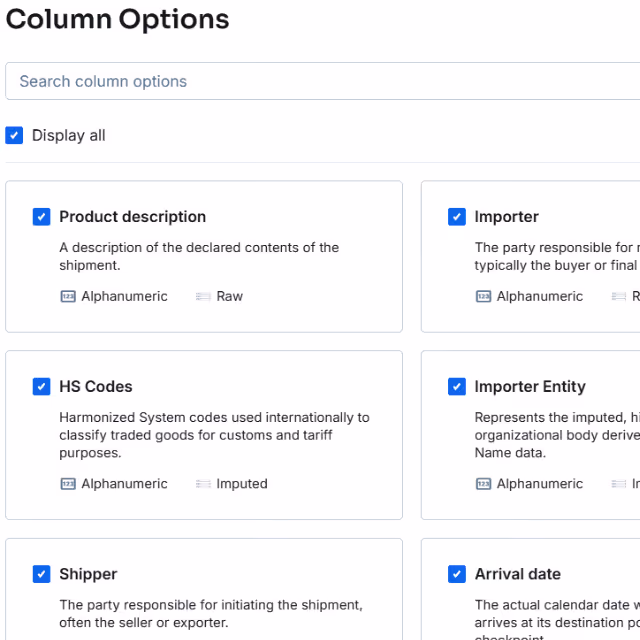
Advanced analytics & custom reports
Analyze TEUs, container counts, product volumes, and shipment frequencies with one-click visualizations.

Built for these teams
See competitor shipment volumes as they rise, fall, or shift
Start tracking the timely signals behind competitor growth and market strategy.

Frequently asked questions
We use verified customs filings that include TEUs, container counts, weight, quantity, and shipment-level details.
Yes — analytics lets you compare competitors side by side by volume, product, timeframe, or port.
Yes. Data updates continuously, and any new shipments appear automatically in your dashboards.
All shipment data and analytics can be exported in CSV, Excel, or saved directly inside your dashboard.
Absolutely. Filter by product category, HS code, or specific SKU-level patterns to understand growth areas.